Debugger & Tracing
Because every LLM call, tool invocation, HTTP request, and human input flows through a chidori.* host function, Chidori can record a complete, structured trace of everything an agent did — inputs, outputs, durations, and token usage. That trace is also a checkpoint: feed it back to the runtime and you get an identical replay with zero LLM calls.
For production observability, Chidori also emits standard OpenTelemetry traces over OTLP/gRPC — one span per host function call — so every run can flow into Tael, Jaeger, Tempo, Honeycomb, Datadog, or any OTLP-compatible backend by setting a single env var.
Four ways to inspect a run
1. The --trace flag
The simplest option. Run any agent with --trace and the full call log streams to stderr as structured JSON:
chidori run agents/researcher.ts --input question="What is Rust?" --traceEach entry looks like:
{
  "seq": 1,
  "fn": "prompt",
  "args": {"text": "Generate 3 search queries...", "model": "claude-sonnet"},
  "result": "[\"rust language\", \"rust memory safety\", \"rust vs c++\"]",
  "duration_ms": 2024,
  "token_usage": {"input_tokens": 26, "output_tokens": 66},
  "timestamp": "2026-04-11T21:10:24.362337Z"
}2. The session API
When the agent is running under chidori serve, every execution is a session with its own ID, checkpoint, and replay endpoint:
POST /sessions                  → create session, run agent
GET  /sessions                  → list all sessions
GET  /sessions/{id}             → get session result
GET  /sessions/{id}/checkpoint  → get the call log
POST /sessions/{id}/replay → replay from checkpoint# Run
curl -X POST http://localhost:8080/sessions \
-H "Content-Type: application/json" \
-d '{"input": {"question": "What is Rust?"}}'
# Grab the checkpoint
curl http://localhost:8080/sessions/c4cac6c7-.../checkpoint > session.json
# Later: replay — zero LLM calls, identical output
curl -X POST http://localhost:8080/sessions \
-H "Content-Type: application/json" \
-d @session.json3. OpenTelemetry → Tael (or any OTLP backend)
For production observability, Chidori emits standard OTLP/gRPC spans — one parent span per run, one child span per host function call — whenever OTEL_EXPORTER_OTLP_ENDPOINT is set:
export OTEL_EXPORTER_OTLP_ENDPOINT=http://127.0.0.1:4317
export OTEL_SERVICE_NAME=my-agent   # optional

chidori run agents/researcher.ts --input question="What is Rust?"Each child span carries call.seq, call.fn, call.duration_ms, and — for prompt calls — gen_ai.request.model, gen_ai.usage.input_tokens, and gen_ai.usage.output_tokens following the OTEL GenAI semantic conventions.
The recommended pairing is Tael — a CLI-first, JSON-native observability platform built for agent development — but anything that speaks OTLP/gRPC on port 4317 works (Jaeger, Tempo, Honeycomb, Datadog, OpenTelemetry Collector).
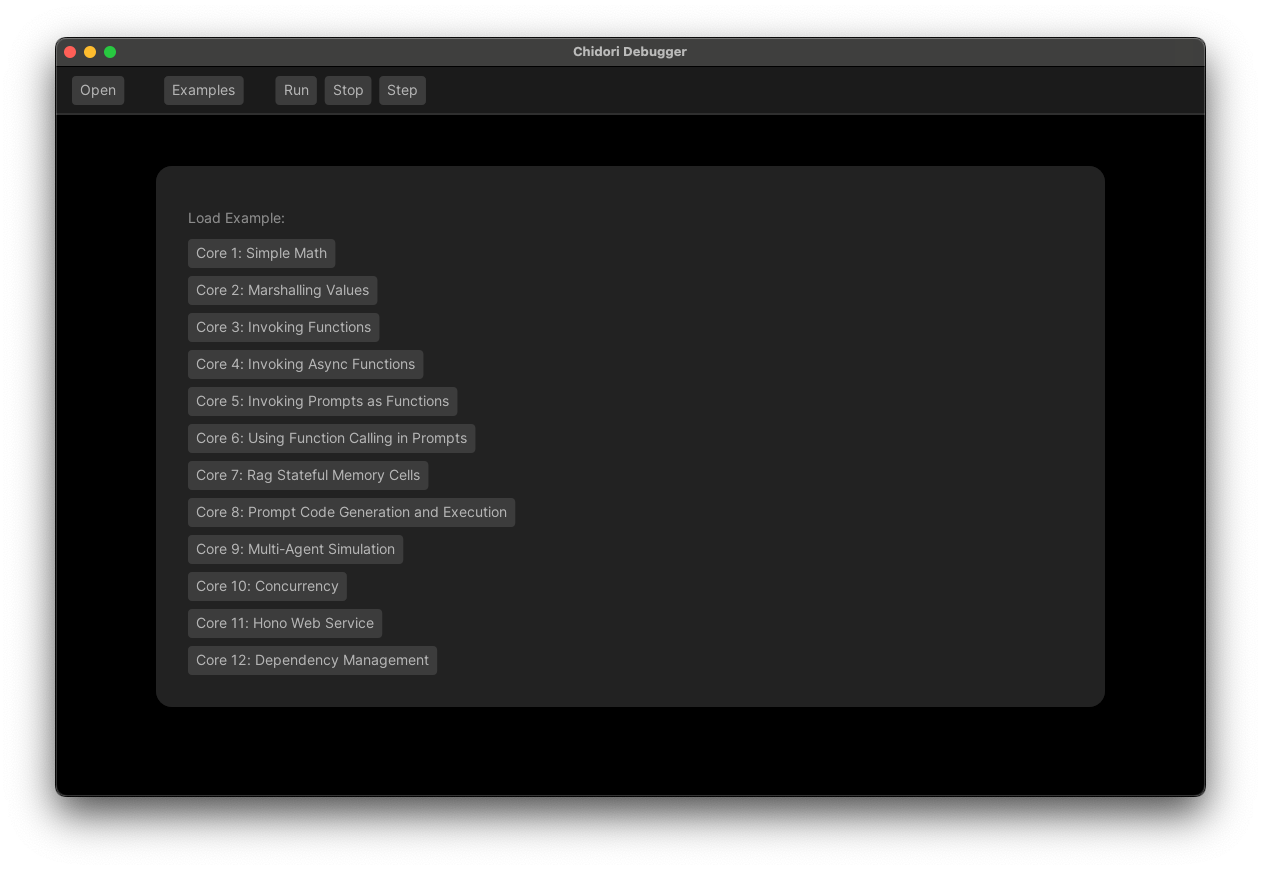
4. The Chidori Debugger UI
A desktop app that visualizes the call log as an interactive timeline — step through each host function call, see the exact prompt and response, and branch into "what-if" replays where you edit an earlier result and watch the agent take a different path.
cargo install chidori-debuggerPoint it at a running chidori serve instance or load a checkpoint JSON directly from disk.
What tracing gives you
- Debugging — reproduce a failed production run locally without burning tokens.
- Testing — check a checkpoint into git, then assert the
agentoutput hasn't regressed. - Crash recovery — if an agent crashes, replay from the last recorded call to resume.
- Human-in-the-loop —
chidori.input()suspends execution and saves a checkpoint; a human replies, and the agent resumes exactly where it paused. - Cost analysis — every call has
token_usageandduration_ms; aggregate across sessions to find expensive paths.